P&L Dashboard — the full deliverable
The owner dropped a bookkeeping export into Shared/ and asked to see where the money went. The Accounting agent returned two things: the dashboard, and — the part a chart can't do — a written read on what it means and what to do about it.
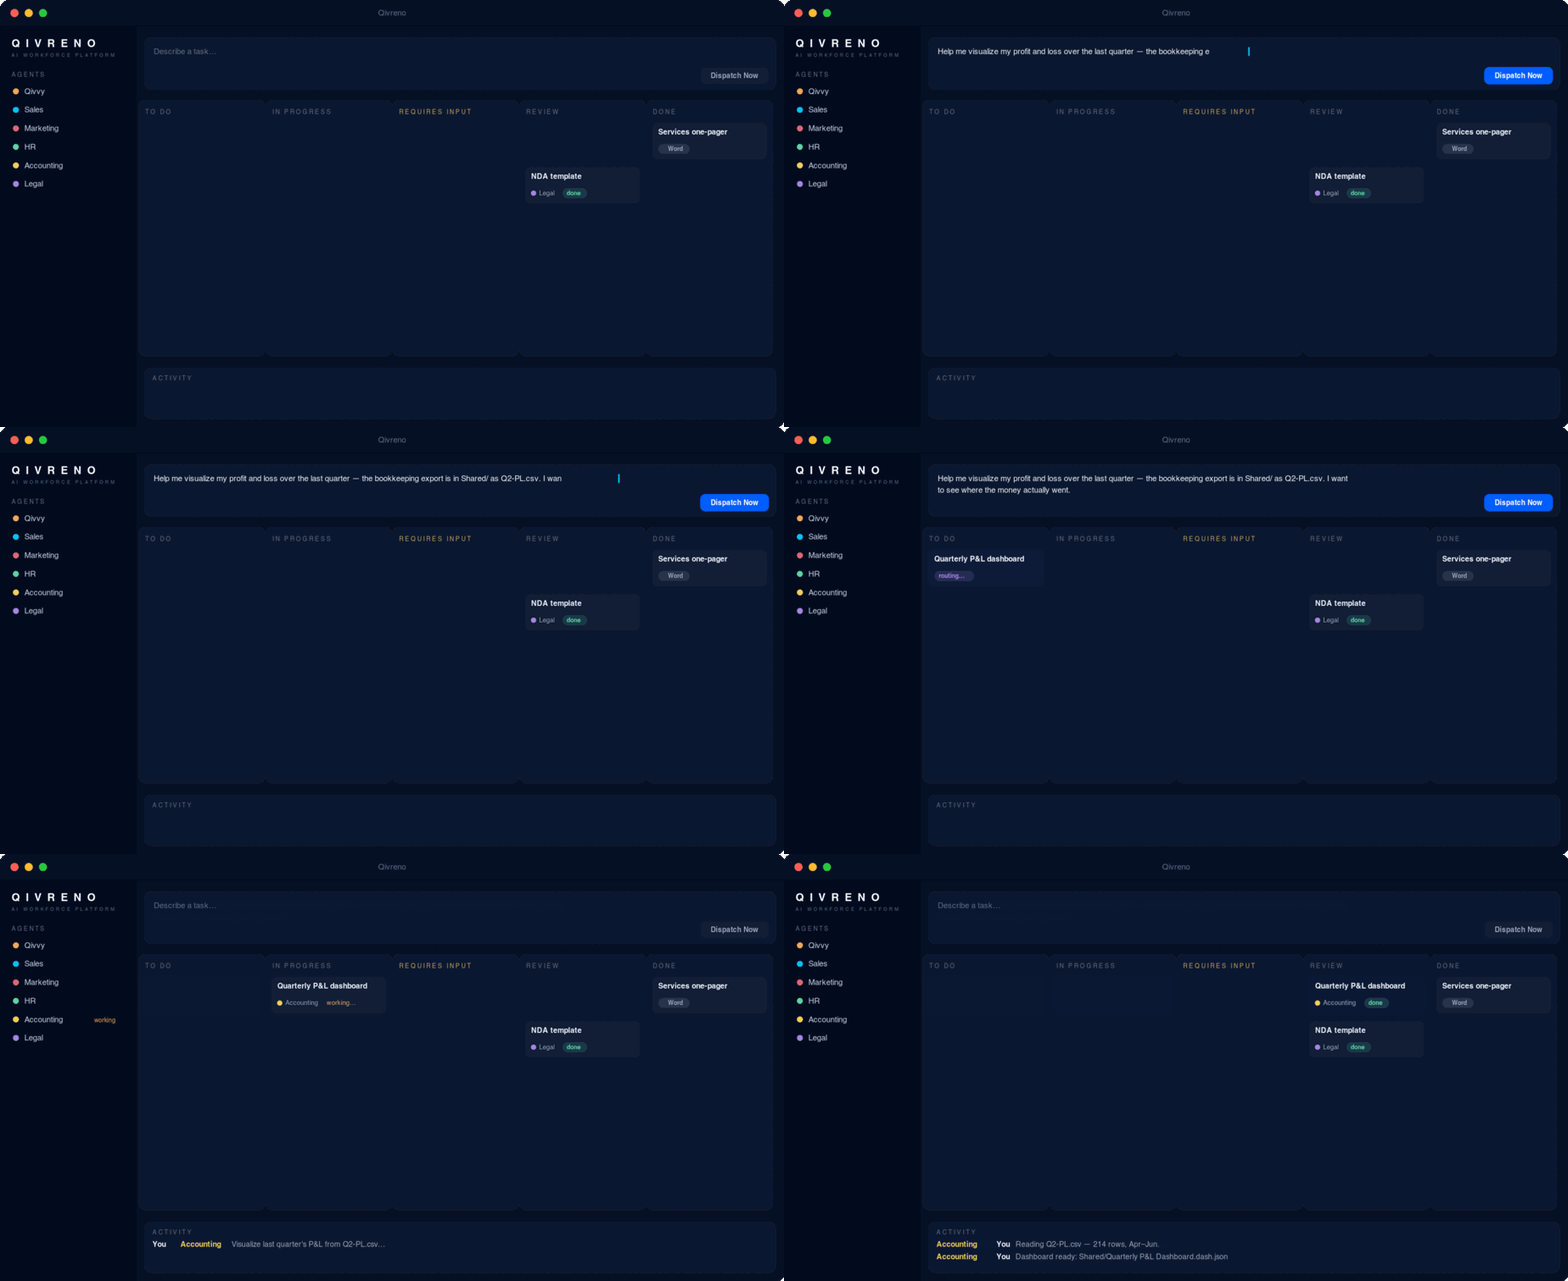
Deliverable 1 · Quarterly P&L Dashboard.dash.json — live in the app; exports to HTML & PDF
| Line item | Q2 | vs Q1 | Note |
|---|---|---|---|
| Payroll (4 FTE) | $186,400 | +2% | steady |
| Contractors | $53,700 | +41% | May spike — see insight 1 |
| Software & tools | $38,400 | +6% | 14 subscriptions — see insight 3 |
| Travel & client visits | $24,750 | −8% | fine |
| Marketing | $21,300 | +4% | under-invested vs plan |
| Insurance & professional | $14,900 | flat | renewal due Oct |
| Office & misc | $13,650 | +3% | fine |
Deliverable 2 · The agent's read — Q2 P&L Insights.md, attached to the same task
The dashboard shows what; this is the so what. Three insights, each sized and turned into an action:
Contractor spend ran $23,400 in May — double the norm — while two client projects sat idle awaiting materials. Cross-checking invoices against the project log: roughly 60% of those hours weren't billable to any engagement. Action: require a project code on every contractor invoice, and pre-approve anything over 10 hrs/week against booked work. Worth ~$5k/quarter at Q2's run rate. (A "contractor invoice rule" task is ready in Review — approve it and Accounting enforces it monthly.)
June's $153k was the best month ever, but $46k of it came from the lowest-margin service line (staff-augmentation style work at ~18% vs ~34% on assessments). Growth is currently coming from the work you least want to scale. Action: hold assessment pricing firm, and route the next two aug-style inquiries toward assessment-first engagements. Even one conversion is +$4–6k gross margin per quarter.
Five tools show login activity from one person or none in 90 days (project tool duplicated by the ops suite, two design seats, a legacy CRM, an analytics add-on). Action: cancel or downgrade the five — ~$9,800/yr back, no workflow change. (The cancellation checklist is drafted; the renewal dates are on your calendar via the Calendar integration.)
Fixing all three is worth roughly $19–21k a quarter — about a third of Q2's entire net profit — and none of it requires new revenue. Insight 1 is the fastest: the invoice rule can be in force this week.
Fictional company; representative output, edited for length. The dashboard is a live file — drop in next quarter's export and ask the team to refresh it.